Table actions
Table view
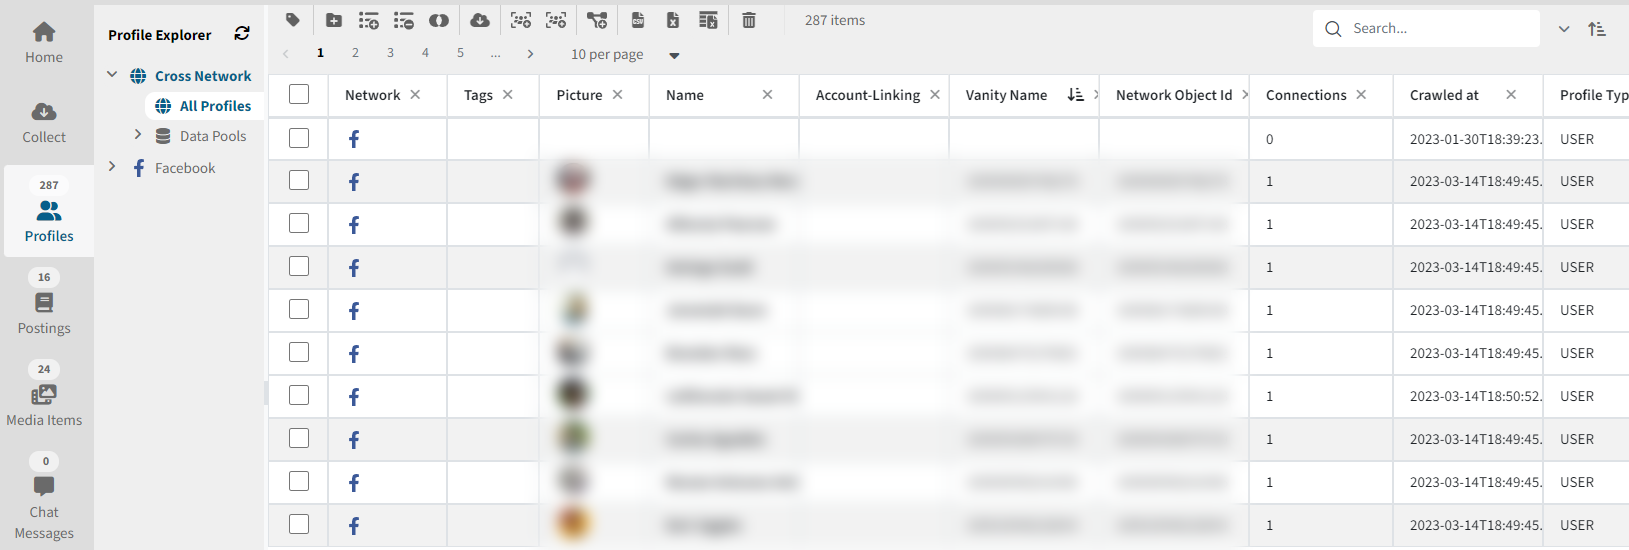
In Maltego Evidence, the table view contains a representation of the collected data in the selected case, depending on the selected data collection. Each row contains a record and each column contains certain information.
Accessing the table view
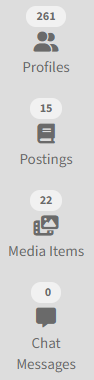 | The table view of Maltego Evidence is available via the left menu if the corresponding data is available. Here you can open the table views for profiles, postings, media items and chat messages. The columns may vary depending on the data collected, but typically they contain information such as the username, profile URL, number of followers or friends, content of a post, number of likes or comments, etc. |

Basic functions
Sorting
The sorting function allows data in a given column to be sorted alphabetically, numerically or chronologically, depending on the type of data.
This facilitates the search for specific entries and helps to find relevant entries faster.
The sorting function is activated or deactivated by clicking on the corresponding column caption. Sorting can only be activated in designated columns.
Sorting by ascending order
![]()
Sorts entries in ascending order (Z-A, 9-0, from later to earlier).
Sorting by descending order
![]()
Sorts entries in descending order (A-Z, 0-9, from earlier to later).
Display size
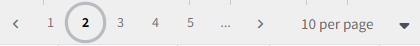
Above the first line (designation of the columns) the number of displayed entries per page can be selected, as well as switching through the corresponding pages.
Total entries
On the right side of the toolbar, above the page selection, you can see the total number of entries in the selected area (profile, postings, media files or chat messages).

Search function

Am rechten Bildschirmrand befindet sich die Suchfunktion, mithilfe dieser kann im gesamten ausgewählten Datensatz, in jeder Spalte, nach Inhalten gesucht werden kann.
Complex search and filters
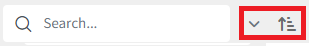
Using the button located on the right side of the search, complex searches and filters can be set. It is also possible to remove certain columns from the view using the drop-down menu that opens. The data records remain unchanged, only the display within the table view becomes invisible.
Regular expressions
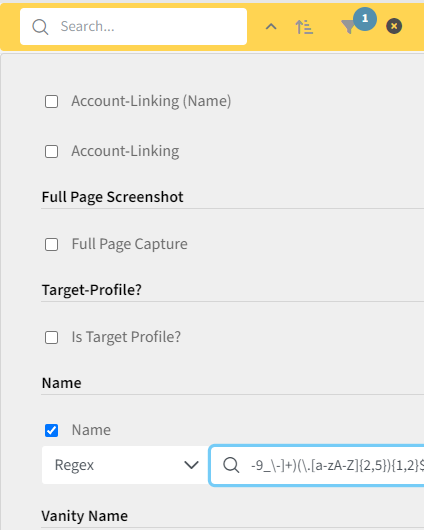 | Here, using the example of user names within the table, regular expressions are used to search for email addresses within the user name in the dataset using the complex search function. Regular expressions can be used by users to search for specific patterns, such as email addresses, URLs, phone numbers, etc. within the secured dataset. |
Toolbar

Depending on the selected view, there are up to twelve buttons in the toolbar in the upper area, which are divided thematically into seven areas (keywords, data pools, data collection, account link, download and delete). With the help of these buttons, various functions can be activated to enrich, edit or delete the data pools. For example, new data collections and backups can be initiated without having to leave the overview.
| ATTENTION: The functions from the toolbox described below are only applied to the profiles that have previously been marked in the first column. Using the first column, all data sets / rows can be marked. |
Tags
Using the first button, one can add keywords ("tags") to a record, but these must have been defined beforehand.
Overall, the use of tags in a table function can be a simple and effective way to mark and organize profiles for specific purposes.
Data pools
The data pools section includes four buttons:
More information about data pools can be found here.
 | Create a new data pool with the selected profiles |
 | Add the selected profiles to an existing data pool. |
 | Remove the selected profiles from a data pool. |
 | Adds all profiles of common friends of the selected profiles to a new data pool. |
Collecting data for profiles
This function opens the backup dialog for the selected profiles.
In this way, additional profiles can be quickly secured for which only basic data from previous surveys previously existed.
New account linking
Links two or more similar entities (e.g. profiles) with each other, if they belong to the same person, for example.
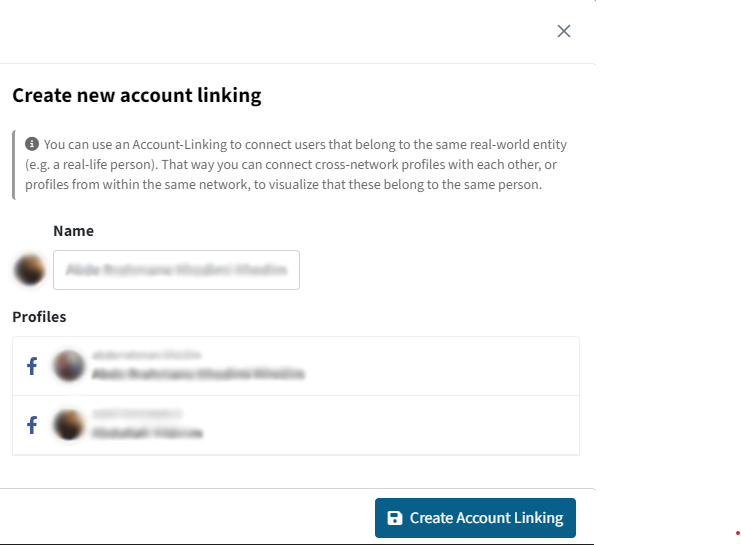
After selecting at least two profiles and pressing the button, the dialog for creating a new account linking opens.
In the upper field, you can choose a name for this connection or you can use a profile name.
In the lower field, you can see the profiles that will be linked together.
Add to Analytics
Add the selected records to the Analytics (add ANALYTICS doc link) module.
Export functions
This area includes various export functions for different file formats.
More details about the different export functions of Maltego Evidence can be found here.
Delete
This function is used to delete the selected profiles.
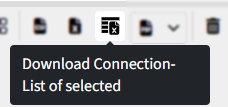
Export connected profiles
The function is used to generate an XLSX file for each selected user, which is then downloaded automatically. If several profiles are selected, a .zip file containing all .xlsx files is created.
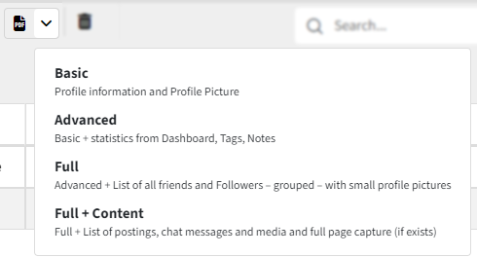
Generate quick PDFs
This function allows you to generate detailed reports for the selected objects in no time at all. There are different report options for each entity type, which can be selected in the dropdown. If you click directly on the PDF report button, the most compact layout is selected.
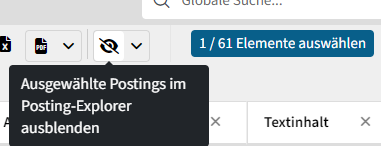
Hide and show objects
Hide objects
Instead of deleting objects from the data explorer, they can be hidden. To hide one or more objects, select the relevant objects in the data explorer and then click on the "Hide objects" button.
Show hidden objects
To display the hidden objects, click on the "Show only hidden objects" button next to the button for the filter options.
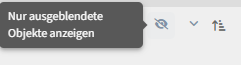
An active filter is then displayed in the toolbar and the button to display only hidden objects is updated.

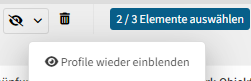
Show objects
To make hidden objects visible again, first follow the instructions as described in the previous section to display all hidden objects. Then select the objects in the table that you want to make permanently visible again. Then click on "Show profiles again" in the drop-down menu of the button for hiding objects.
Remove the filter to display hidden objects in order to return to the original view.