07 Reports
The Report Builder allows you to summarize collected data and analysis graphs in a PDF report. To add data to the Report Builder, you must first add it to a data pool and then add the entire data pool to the Report Builder. For more information, see the Data Pools section. To add a graph, you must first create it in Analytics and then add it to the Report Builder. For more information, see the Analytics section.
How do I create a report?
To display all the reports already created in a project, click the "Reporting" button. Then, under the "Reports" heading, click on "Create new report" to create a new report.

Overview of all reports already created
After you have created a new report, you will be taken to an overview page. More information about the individual components can be found further down this page.

Start screen for creating a new report
(1) Report data
The report data contains general information about your report, such as the case ID, author, responsible authority, and date. You can click the pencil icon to customize the data, and then click OK to save the new data.

Window for editing the report data
To add an image to the report that will be displayed on the front page of the PDF report, click the image icon and select an image from your files.
(2) Save
You can save your report manually or have it saved automatically every 20 seconds. To save the report manually, click on the "Save" button. To switch between automatic saving and manual saving only, click the button to the left of "Save automatically".
(3) Content editor
To add text or widgets to your report, you must first create a section. A section corresponds to a chapter of your report, which you can give a title and a description.
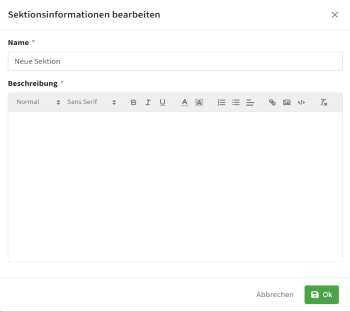
Window for creating a new section
If you want to add another section to your report, click the "Add Section" button below the last created section. You can edit the order of the sections under "Navigation" by dragging and dropping them to the desired location. To move a section in the order, click the up or down arrow in the section header.
![]() Click this icon next to a section to jump directly to a specific section.
Click this icon next to a section to jump directly to a specific section.
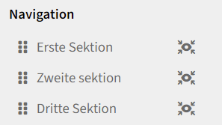
Navigation menu
After you create a section, you can add a widget from the list of available widgets by dragging and dropping it into the section. Click the widget to edit its description and title. For more information, see point (4).
Sections and widgets can be deleted by clicking the trash can icon.
(4) Widgets
This section lists all the data pools and charts you have added to the Report Builder. To add a widget to your report, drag and drop it into a section. You can add a description and title for each widget within the section.
For data pool widgets, you can decide whether to include all objects or only a specific selection of objects in the report. You can also specify whether tags and images of the objects should also be printed.
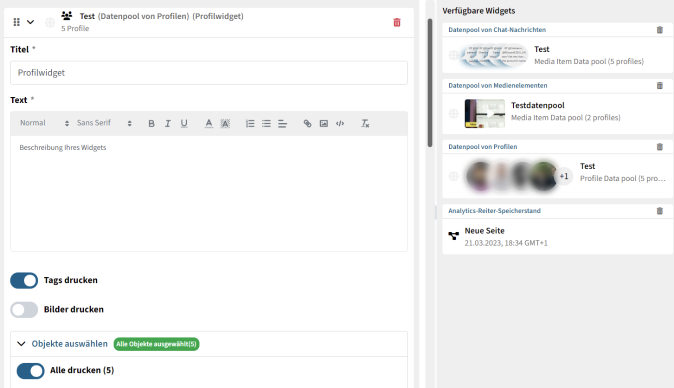
Editing a data pool widget
For graph widgets, you can print a table next to the chart with all users, posts, media items or chat messages.
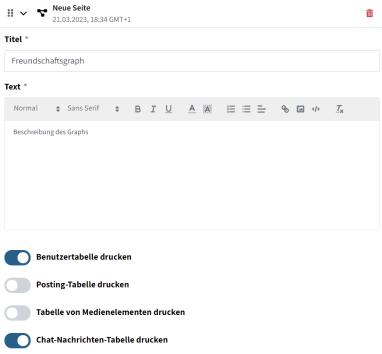
Editing a graph widget
(5) Generate PDF
When you have finished editing your report or want to display the current status of the report as a PDF, click on "Generate PDF". After a short waiting time, a window opens in which the generated PDF is displayed. In this window you can also print or download the PDF. To download, click the icon next to the X in the upper right corner. After that, you need to choose a location to save it. To print the PDF, click the printer icon inside the PDF display.
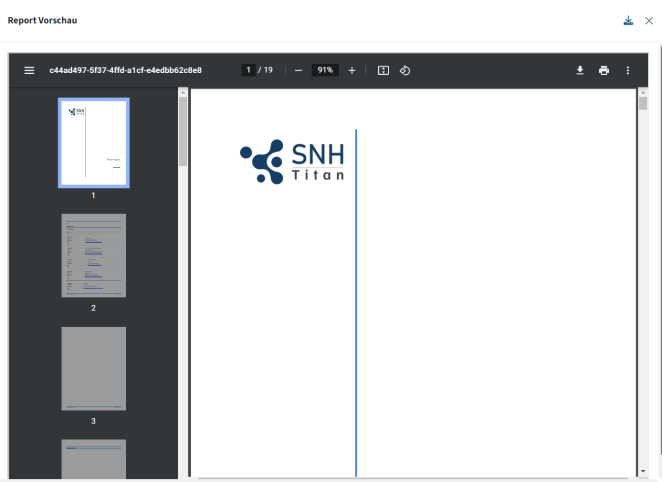
Display window of the generated PDF